Tuesday, February 15, 2022
No, a recent report has NOT found Graphene in COVID vaccines
The idea that COVID vaccines contain the nano-particle material graphene is a particular myth that refuses to go away. While graphene has a number of desirable properties in biomedical applications, it is not yet used in vaccines.
However, a new "report" claims that they have found "graphene" in vials of Pfizer, Moderna and Astra-Zenia COVID vaccines. TL;DR this is nonsense on stilts. Why? let me explain.
As a bit of background, I am a biomedical scientist. I have a lot of expertise in optical microscopy (bright field, fluorescence) and some expertise in electron microscopy. I also have expertise in UV-visible spectroscopy and experience with Nuclear magnetic Resonance and Mass Spectroscopy (although the latter is usually me nodding at my collaborators spectra trying to look intelligent).
With that background, let look at the "report", "Qualitative Evaluation of Inclusions In Moderna, AstraZeneca and Pfizer Covid-19 vaccines.". It uses two techniques to find "graphene" in the vaccines, optical microscopy and Raman spectroscopy.
Optical microscopy:
The problem with optical microscopy is that nano-materials are, well, nano, with sizes typically below the resolution threshold of optical instruments. The "report" says that aliquots of vaccine were placed on "clean" slides, dried, then cover slips placed on them. No details are given on how the slides were cleaned, if the cover-slips were cleaned, and what mounting medium was used.
Looking at the images I see the typical junk that ends up on slides (even cleaned ones and we use acid washing with ethanol rinses on the slides and cover-slips). Stray fibers and the agglomerations you get from drying complex solutions (particularly with lipids, the lipid nano-particles will aggregate as they dry into little blobs of fat). The "carbon nano-ribbons" (Figure 3.1) are not nano (approximately 7 µm in diameter), and the images in 3.2 are definitely not nano (15 µm across) and are the typical junk that accumulates of slides and cover-slips.
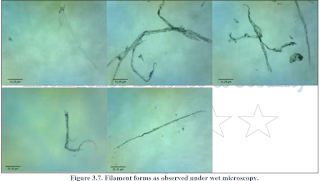
These random blobs and fibers are all (aside for some described as calcite) described as graphene with out any good evidence. Which brings me to Raman spectroscopy.
Raman Spectroscopy:
Spectroscopy of any sort of complex mixtures, like vaccines, is fraught with difficulties. Multiple components can interfere with each other and you can find peaks where you don't expect peaks. The "report" shows numerous Raman spectra, but they are all uniformly awful.
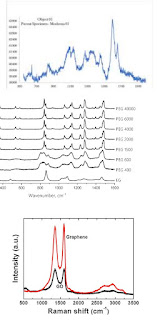
in this image (click to embiggen) I have posted the best spectrum from figure 3.11 (labelled "graphene with polyethylene glycol") above the spectra for polyethylene glycol (the PEG used in vaccines is PEG2000) and Graphene and graphene oxide (GO). The scales for the Raman shift are different in all the images, I can't do much about that. But the main thing is too look at the patterns.
The reports figure is very poor quality, so being sure of the peak locations is difficult but there are peaks around 800, 1100 and 1400 Raman shifts (cm-1) the may correspond to the 830, 1108 and 1470 peaks for PEG. There are a bunch of other peaks that don't quite fit with PEG (eg the peak around 1700 cm-1).
Graphene and Graphene oxide (GO) have distinct peaks at 1354 and 1591 (cm-1). There is a peak in the mess that is around 1600 cm-1 but the 1354 peak is missing.
So, no graphene.
Summary:
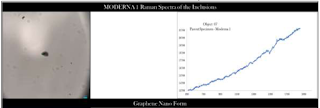
The "evidence" for graphene in the vaccines is random fibers and blobs which are not nano-scale, and poor resolution Rama spectra which don't show the spectral signature of graphene.
So no graphene in vaccines.
Given the poor image resolution the amateurish backgrounds and the obvious artefacts, the heading of "Global Humanitarian Crisis Prevention and Response Unit" on every page with a terrible graphic logo, I can't help but wonder if this is some sort of joke.
EDIT:
Labels: Pseudoscience, public outreach, science matters, vaccines

Sunday, September 24, 2017
The Earth did not end on September 23 2017 (But then, you knew that)

Oh, I'm sorry, that's the line up in 1827.. (Hmm, the earth has not ended in the intervening century).
Well, September 23, the date, according to numerologist David Meade, of the great sign of Revelation 12, where the spiritual beginnings of the apocalypse will occur, to be followed up by the impact of the imaginary Planet Nibiru on or Earth, has come and gone.

So, what happened, we had the Solstice (spring in the Southern Hemisphere, Autumn in the North), a very nice day here, warn and blue skied, and nice evening line-up of Spica, Jupiter and the Moon (which will still be nice tonight), although the Moon will be further away.
And that was it. Nibiru failed to appear. David Meade has suspended the apocalypse until some unspecified date in the future.
But we all knew this would happen, didn't we. We survived the end of the earth in 2012, the end of the Earth from Comet ISON and the end of the Earth from comet Elenin. Some simple simple astronomical knowledge heled usalong.
Assuming that we can trust the interpretation of the "woman clothed with the sun" as being the astrological constellation of Virgo when the suns is in it, the occurs EVERY September. The Moon will be at Virgo's feet at least once every september too. Jupiter, which is supposed to be the "male child" in the prophecy, is currently in Virgo not far from Spica, and will move out of Virgo over the coming Months (the "giving birth" thing). Jupiter have an orbit of roughly 12 years, so reoughly every 12 years of so we will have a woman clothed with the sun, with the moon under her feet, giving bith to a child. Hardly the 7,000 year unqiue line up.
WHat about the crown of 12 stars, This si particularly arbitray (there are any number of stars above the "Head" of Virgo). There are 13 unaided eye visible stars in Leo, and you can add in the planets as well. Theses line-ups with the added Planets are rarer, EarthSky found at least 4 others in 1827, 1483, 1293, and 1056. I've illustrated the 1827 one above.
Notably, the world did not end after the 1827 Revelation sign, despite months and years passing. The same will happen with this revelation sign.
What about Nibiru. It is a figment of the imagination. In the same peoid that this supposed bigger than Jupiter palent was supposed to come close to us, amateur and professional astronomers tracked a tiny space probe, found a new Dwarf Planet, multiple new asteroids and generally failed to see anything as obvious as a mega Jupiter heading towards us (it would be the brightest object in the sky, other than the Sun and Moon, for many months before it came close to us, even if it was pitch black).
Because it isn't there.
So next time someone tries to scare you with an astronomical doomsday, just say no. You've survived at least four, you are not scared any more.
Labels: Astronomy, Pseudoscience, science communicators
Friday, December 25, 2015
The Christmas Eve Asteroid 2003 SD220 is Not Nibiru (and will not cause Earthqaukes)
 |  |
| Location of asteroid 2003 SD220 at 5:00 am ACDST on Christmas morning as seen from Adelaide Australia, just after it's closest approach. Click to embiggen. | The Earth and Moon as seen from 2003 SD220 as simulated in stellarium. |
Asteroid 2003 SD220, also known as the Christmas eve asteroid, will come close to Earth on 13:08 UT 24 December (that is 00:08 am AEDST in Australia) at distance of 0.073 AU. Visible only in high powered telescopes at closest approach, it has gained unwarranted attention from breathless articles in the tabloid press claiming that it could cause earthquakes (it won't, just like the other asteroids didn't). Various fringe sites have suggested it is, or is linked to, an imaginary planet called Nibiru (it''s not).
To put this in perspective, at its closest 2003 SD220 is around 28.4 Earth-Moon distances away this time. Yes, that is over 28 times the distance from the Earth to Moon (recall that the Apollo missions took 3 days to get to the Moon). As you can see from the image above, 2003 SD220 will only see the Earth and Moon as faint dots.
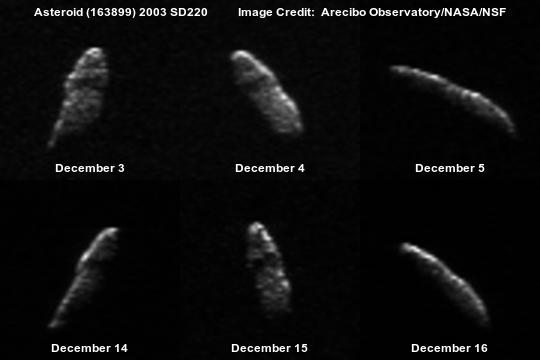
As well, other large asteroids are being ignored favour of 2003 SD220. What about 2008 CM, a 1.5 km wide asteroid that will pass us by at 22 Earth-Moon distances on December 29. No one is claiming IT will cause earthquakes of is Nibiru.
So bottom line, 2003 SD220 will pass us by harmlessly, like all the other large asteroids we have been following.
For those of uswho just want to play around with the asteroid orbit, or who want to argue with people who claim this asteroid will hit us (it won't) I've made Celestia files for 2003 SD220. As usual, copy the data here to a plain text file (2003SD220.ssc) and copy the file to the Celestia extras folder.
========= >8 cut =============2003SD220.ssc=======>8; cut =====================
"2003 SD220" "Sol"

#Data from MPC http://cfa-www.harvard.edu/iau/MPEph/MPEph.html
#Epoch 2016 Jan. 13.0 TT = JDT 2457400.5  (M-h)          MPC
#M 257.16312              (2000.0)            P               Q
#n   1.30903706     Peri.  326.44287     -0.48635381     +0.86135024             T = 2457479.05918 JDT
#a   0.8276272      Node   274.06174     -0.76583262     -0.50108247             q =     0.6533014
#e   0.2106332      Incl.    8.46007     -0.42066657     -0.08361889    Earth MOID = 0.01840 AU
#P   0.75           H   17.0           G   0.15           U   2
#From 217 observations at 8 oppositions, 2000-2015, mean residual 0".46.

{
    Class "asteroid"
    Mesh   "ky26.cmod"
    Texture "asteroid.jpg"
    Radius  1.0 # maximum semi-axis
    MeshCenter [ -0.000718 -0.000099 0.000556 ]

    EllipticalOrbit
    {
    Epoch                         2457400.5       # Epoch 2016 Jan. 13.0 TT = JDT 2457400.5
    Period                             0.893737187           # P
    SemiMajorAxis          0.8276272      # a
    Eccentricity                0.2106332      # e
    Inclination                  8.46007          # Incl.
    AscendingNode          274.06174       # Node
    ArgOfPericenter       326.44287       # Peri
    PericenterDistance      0.6533014     # q
    MeanAnomaly          257.16312       # M
    }

    RotationPeriod 11 #Measured

    Albedo 0.15        #Based on typical Stony asteroids, rotation periods vary from one hour to one day

}
========= >8 cut =============2003SD220.ssc======= >8 cut===================== Labels: asteroids, celestia, earthquakes, Pseudoscience, public outreach
Thursday, December 24, 2015
Comet 2010 X1 Elenin, Earthquakes, Astronomical Alignments and Mensur Omerbashich
 There is still widespread angst that comet 2010 X1 Elenin will cause significant earthquakes when it comes close to Earth later this year.
I’ve shown previously that Elenin is not associated with earthquakes, however, in the comments (and on the intertubes), an as yet unpublished paper by Mensur Omerbashich titled “Astronomical Alignments as the Cause of ~M6+ Seismicity” http://arxiv.org/abs/1104.2036 is referenced. The paper purports to show that astronomical alignments, particularly that of Elenin, are the proximal cause of earthquakes of magnitude 6 or stronger. To save you time before you read the paper and my critique of it, I’ll give you a short and long summary.
Short Summary: It’s nonsense on stilts.
Longer Summary: A sloppy paper which presents incorrect data. It ignores basic information on comets, basic physics and its “evidence” is drawing lines thorough planets.
The idea that gravitational influences could alter the frequency of earthquakes is plausible. The tidal bulge in the Earth (as opposed to the tidal bulge in the ocean) is about 30 cm, and a periodic flexing of the crust by 30 cm could indeed trigger earthquakes. Indeed, there is a weak correlation between the lithospheric tides associated with Full/New Moon and a subclass of shallow earthquakes (increasing the probability of this subclass of earthquakes by less than 1%).
 On the 27th of February 2010, Elenin was beyond the orbit of Jupiter, but it is claimed that it had more tidal effect than bigger comets and asteroids closer to Earth.
However, tidal force drops of as the cube of the distance. The Sun is much more massive than the Moon, but the Moon has a bigger effect on Earth's tides because it is so much closer.
Venus has around the same mass as the Earth, and is the closest planet to us, but it produces roughly on ten millionth of the tidal force on Earth than the Moon does. If the Moon is not very effective at producing earthquakes, Venus sure won’t be (and invoking electrical or magnetic forces won’t work either, they fall off rapidly with distance too).
To assert that planetary alignments are a significant influence on earthquakes you will need some pretty strong evidence, does this paper supply it?
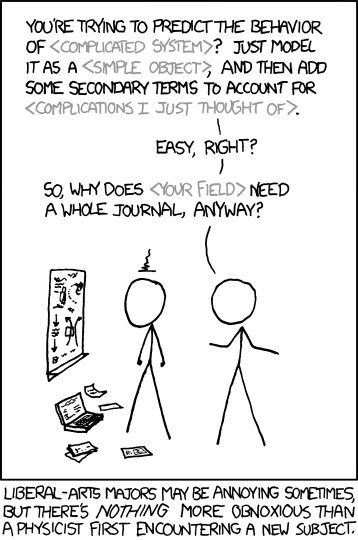 XKCD sums up the problems with the paper.
Coma confusion: You know the paper is not going to go well when it starts off with “..[Elenin] drags with it a cloud of gravitational locked particles around 30,000 Km across, making its gravitational shadowing significant …[page 1 para 4]”. Leaving aside the question of what “gravitational shadowing” is (it is never defined), Dr. Omerbashich is describing the coma of comet Elenin.
However, the coma is by no means “gravitationally locked” the particles in the coma are only loosely bound and are readily lost, the coma only appears stable because new dust particles are currently being added by outgassing from the comet.
Indeed, as I type Elenin’s coma is dispersing, as its dust production rate has dropped (possibly due to having exhausted a layer of volatiles, eg frozen carbon dioxide, below the comets crust). Also, while the coma is thick by interplanetary standards, from the point of view of Earth the coma is still a pretty good vacuum, with negligible mass compared to the parent comet.
Not only that, a coma is a feature of all comets that approach the Sun closely, for example comet 81P Wild had a coma of 50,000 Km and 103P Hartley had a coma of 150,000 Km. Because the coma is dynamic, produced as a comet heats up, at the early time points Omerbashich considers, Elenin’s coma would be much, much smaller.
 Source: Wikipedia Commons.
What’s missing? The first thing that stands out when you read the paper is what is missing. All the classical planets, as well as Uranus and Neptune, are considered along with comet Elenin. But it’s obvious what is missing.
Where are all the Main Belt Asteroids? If you are going to consider a 4 Km wide frozen snowball, then large chunks of real estate like Ceres, Vesta (529 Km in diameter), Pallas and Juno should be considered as well.
And what about the 46 comets that reached perihelion in 2010, especially comets comparable to Eleinin such as Comet 81P wild, a comet of 4 km diameter with a 40,000 km coma, that came within 1.2 astronomical units (AU) of earth and comet 103P/Hartley, a 2 Km diameter comet with a 150,000 Km coma that came within 0.13 AU of Earth? Why aren’t they included if Elenin, which was more than 6 AU away for most of the year, is?
What’s also missing is the Moon, mostly. There are a few lunar alignments shown, and 14 of the 24 Full and New Moons are marked in table 1, but as the Moon is the closest, most important tidal object in our sky, the complete lack of 10 lunar encounters is significant.
Figure failure Figure 1, (section B shown below) purports to show the “resonance magnification pattern” as a “gravitational shadow” traverses the Earth.

What it in fact shows is a series of graphs of earthquake magnitude vs time. Each quake is shown equidistant from the others, regardless of the actual time separation between them. As well several points are left out, this greatly distorts the actual data.
For example graph B of figure 1 shows the series of earthquakes from 10 January to 12 January. It looks like a smoothly rising curve (possibly correlated with the “gravitational shadow”, whatever that is). However, only one magnitude 5.1 quake is shown, whereas there were many 5+ quakes in this time period. Also, the time point of 11 January is omitted even though there were no quakes of 5+ in this period of time (the other graphs have similar issues). This makes the curve look quite different from reality.
 This graph shows how it should have been done (click to embiggen). I have plotted quake magnitude vs Julian Day number since 8 January for the interval between 9 January and 14 January, (full Julian day numbers make the graph unreadable), UT times of earthquake occurrence being rounded to the nearest half hour for conversion to Julian dates.
During these dates Venus was a degree or closer to the Sun (Omerbashich never really gives a numerical criterion for what constitutes an alignment). I have also plotted the tidal force due to Venus at the time of each earthquake (Calculated from the formula below using Excel, planetary masses and distances from SkyMap and earthquake magnitude from here), it is falling over this period as Venus is moving away from the Earth.

You can see that this graph is very different to the one that Omerbashich provides, and refutes Omerbashich’s claims. Now this is just one graph out of a whole bunch, but each one has similar, fatal flaws. They all show M+6 events evenly spaced, regardless of when they occurred, and omit relevant 5+ events. When a 5+ event is included, it is to anchor a graph and give a misleading impression of a smooth curve.
 As the tidal effect is actually due to the Sum of the tidal force of Venus and the Sun, I also show a graph with the Sum of the Venus Sun tidal forces (again, click to embiggen). You can see that they are going down. This is mostly due to the earth moving away from the Sun post perihelion, as the tidal force of Venus is one ten millionth of that of the Sun, it doesn’t register in this graph.
Statistics revisited Table 2 of the paper purports to show all M6+ earthquakes in relation to various alignments (it doesn’t, but the discrepancies are minor, just an example of sloppiness). It looks kind of impressive, until you think about it. All Omerbashich is doing is lining up instances of events with earthquakes. Using this method I can show that my family eating pizza causes earthquakes.
On March 4 I had pizza, and there was a M6.5 Earthquake, and again on March 11 (an impressive M6.9 quake) and on March 25 (only M6.6, but there was an M7.5 earthquake when we had pizza on June 16). All in all, 20 times when we had Pizza there was a magnitude 6 or greater quake (actually, we had pizza more times than that, but those are the times that I have dates and UT times for).
Apart from the physical implausibility of my family chowing down on pizzas causing earthquakes (well maybe my increase in weight could do it), how can we determine if eating pizza causes earthquakes? Statistics is how.
In 2010 there were 156 earthquakes of magnitude 6 and over. In 2010 we had pizza 48 times. If the earthquakes were occurring at random with respect to our eating pizza, then we would expect an M6+ earthquake to occur on a day we ate pizza 21 times, and we observed 20 earthquakes on days we ate pizza. Therefore we can conclude there is no connection between us eating pizza and earthquakes (physical implausibility aside).
So, what about the planetary alignments and the earthquakes? The most plausible astronomical source of earthquakes is the Moon, which causes the strongest lithospheric tides. There were 24 full or new Moons in 2010. This is where the Sun and Moon are aligned and we get the strongest tides, which might have a chance of producing earthquakes (or triggering ones that were just about to go anyway).
In 2010 there were 12 earthquakes that corresponded to a full or new Moon. By chance alone, we would expect 10 earthquakes to correspond to the full or new Moon, which is not significantly different from what we observe. We can do a double check, if the alignment idea is correct, then there should be more earthquakes during the full/new Moon (when the tides are highest) than during first and last quarter (where the tides are lowest).
In fact there were 16 earthquakes during first and last quarter Moons compared to 12 during full/new Moon. Thus the idea that lunar alignments are a significant source of earthquakes is disproven. Actually, e have one more trick up our sleeve, I took all M6+ earthquakes from 2000-2010 and did a Fourier transform on it. If the Moon played a significant role, we should have seen a peak corresponding to the interval between full and new Moons. But we don’t, or any other peak corresponding to an astronomical alignment.
This pretty much eliminates all evidence of astronomical alignments playing a significant role in earthquakes.
Omerbashich spends a lot of space on alleged Elenin alignments, but it's just the pizza gambit again. The plausibility of Elenin being responsible for any earthquakes is very low. If the Moon can’t produce significant numbers of earthquakes above baseline activity then Elenin, with a tidal force of less than a billionth of that of the Moon, is not a plausible candidate for producing earthquakes. Again, completely ignores comet 81P (which had a thousand times more tidal force than Elenin) and comet 103P/ Hartley (which had a million times more tidal force than Elenin at its closest approach to Earth). 103P is pretty much devoid of association with earthquakes.
The rest of the paper is pretty much cherry picking figures. Figure 2 basically shows that the occurrence of M8+ earthquakes is pretty random, but Omerbashich claims this shows that comet Elenin (a 4 Km chunk of dirty ice) has been influencing earthquakes since 2007 (when it’s tidal force was a trillionth of that of the Moon). Yet somehow, mysteriously all the other, closer comets (including much bigger ones, like 2006 P1) had no effect.
Conclusion Omerbashich’s paper, “Astronomical Alignments as the Cause of ~M6+ Seismicity” is a poor paper, with inadequate and misleading data analysis, and which misunderstands basic physics and cometary nature. It provides no evidence that Elenin is involved in earthquakes.
Postscript: at this site, it was claimed that planetary alignments as predicted by Omerbashich would produce big earthquakes on 23 May 2011, 23 (and 24) May have come and gone, with only a couple of magnitude 5 quakes, fairly quite days really. Dr. Omerbashich's web site claims 9-19 May as a time of intensified 6+ quakes. It wasn't.
Post-postscript: I've beening trying to think of a really simple way to get the scale differences between Eelnin and the other objects in the solar system that people can grasp easily.
Dr. Omerbashich likens his resonator effect to that of a group of soldiers marching in lockstep across a bridge, causing damaging resonances in the bridge. Well, imagine the Moon is a 70 Kg soldier marching along, behind the soldier is an ant marching. Do you think the ant will add to the resonance produced by the soldier? No, the mass of the ant is far too small. AND that ant is 10 times more massive in relation to the soldier than Elenin is to the Moon.
Disclaimer: small portions of the original paper, less than 1% of that work, are quoted with appropriate citation and links to the original under the fair use provisions of the copyright act for the purpose of criticism, comment, news reporting, teaching (including multiple copies for classroom use), scholarship, or research.
Labels: comets, Pseudoscience
Thursday, September 24, 2015
Call off the Apocalypse, the Lunar Tetrad was a Triad!
 The April 2015 Lunar Eclipse was not a total eclipse, so the apocalypse is averted.
Seeing as we have survived the Asteroid Apocalypse, the Next Big Thing is the final in the Tertrad of Blood Moons, the Total Lunar Eclipse on 28 September.
I've already written why the whole "Tetrad of Lunar Eclipses" and the "end of Days" is nonsense. A tetrad occurs roughly every 10-20 years. The apocalypse failed to materialise after the last tetrads in 1985-1986 and in 2003-2004 and after the many, many more over the past centuries, so it is not going to happen now.
However, there is a far more important reason this coming tetrad will not herald the "End of Days".
It is not a tetrad
The April 2015 Lunar Eclipse, the third eclipse in the terad, was not a total eclipse, so the apocalypse is averted. The original calculations for the length and depth of the April eclipse depended on an old model of depending on the shape model for the Earth's shadow and how the edge of the Earth's shadow is defined.
However, with newer models and calculations, the April eclipse turned out to be quite short. And in reality, it was not quite total either.
You can see images here. My own not so flash images are here, but the bottom line is that the April 4 eclipse was not total. Only by a whisker but still not total.
So, no total eclipse, no tetrad, not "End of Days".
Now those of you who do get to see the eclipse (not Australia unfortunately) can view this lovely spectacle in peace.
Labels: eclipse, Hoax, Moon, Pseudoscience
Saturday, April 12, 2014
No, this coming Lunar Eclipse does NOT herald the End of Days

Predicting the End of the World (or some close approximation thereof) for astronomical events is a cottage industry that has been going on for millennia, the most recent include comet Elenin in 2011, of course the 2012 Mayan apocalypse and comet ISON in 2013 (although the doom does seem to be running out of steam lately).
Now it is Lunar Eclipses (really). If there wasn't enough real issues in the world today, Australian on-line news, the Courier Mail in Queensland, and the Mirror in the UK have been spruiking this "End of Days" nonsense which is linked to the upcoming eclipse.
This month we have a Total Lunar Eclipse coming after the opposition of Mars, in fact we will have four total eclipses of the Moon in 2014 and 2015. The Totally Eclipsed Moon is copper coloured, and Mars is red(ish), so it MUST MEAN SOMETHING!!!! Right.
Every year we have two Lunar Eclipses. To have a Lunar eclipse the Moon must cross Earth orbit when Earth is aligned with the Sun. This occurs twice a year, around 6 months apart (the drift of the timing of this occurrence means that sometimes there are more than two eclipses in a year).
While there are at least two Lunar Eclipses a year, not every year has two total eclipses, slight variations in the Earth-Moon geometry mean that sometimes we get partial eclipses, or the fainter penumbral eclipses, when the Moon passes through Earth outer shadow.
Now having four total eclipses in a row (a tetrad) is fairly rare, currently occurring every 10-20 years or so (it's more complicated than that of course). Note that world has not ended despite multiple instances of tetrads over the past few centuries. The last one was in 2003-2004 (note the world not ending) and prior to that in 1985-1986 (world failed to end again).
Or maybe you need Mars to be in opposition just before or during a tetrad (why? Because it's red of course). The chance of Mars being at opposition close to a tetrad is fairly low, but in 1967 Mars came to opposition on April 15, just before the first total Lunar Eclipse of a tetrad (on April 24 see image above). The world didn't end then either, or in 1909 when Mars came to Opposition during a tetrad, or in 1926 when Mars came to opposition shortly before a tetrad.
The take-home message is that despite multiple occurrences of Mars Oppositions/ Lunar Eclipse tetrads obet the past century there has been no "End of Days", and none in the multiple occurrences that have occured over the past millennia. So this up coming one will not be an "End of Days" either.
I'm not sure why the newspapers are promoting this nonsense, especially since there are lots of interesting things happening in the world to sell newspapers, and since the stories are full of nonsense which can be easily checked and seen to be wromg.
The Australian on-line news quote pastor John Hagee, from San Antonio as saying
"NASA has confirmed that the Tetrad has only happened three times in more than 500 years — and that it’s going to happen now."When a quick check shows that there were tetrads starting in 1909, 1927, 1949, 1967, 1985 and 2003.
Anyway, you enjoy the Total Lunar eclipse of April 15, knowing the End of Days is nowhere in sight.
Labels: eclipse, Mars, Moon, Opposition, Pseudoscience
Friday, December 13, 2013
Earth will NOT be hit by a "Wave of Killer ISON Debris"
 |  |
| Chart showing the predicted position of ISON as seen from STEREO H1A on 1 December 00:09 UT (click to embiggen). The Pleaides is the cluster at centre left in both images. | Image showing the actual position of ISON as seen from STEREO H1A on 1 December 00:09 UT (click to embiggen). The STEREO image has Earth and Mercury in the centre, these are not plotted on the star chart. |
Now that Comet C/2012 S1 ISON has fallen apart into a sad pile of gravel and dust, the fear merchants are at it again. With headlines like "COMET ISON'S KILLER Debris Wave Heading for EARTH" (I'm not going to link to the various pages and give them the page views, but you can google it yourself if you want to kill a few brain cells) the fear merchants are trying to scare people into thinkg a massive strom of rocks is headed our way.
But it isn't.

ISON's predicted orbit takes it well away from us, the nearest the pile of gravel formerly known as ISON comes to us is 0.43 AU (64,000,000 km), that's a bit under half the distance form Earth to the Sun, or the distance from Earth to Venus's Orbit.
i.e. Nowhere near us. I have previously checked ISON's orbit as it came out from its close approach to the Sun in the SOHO LASCO C3 images, it was right on track. I've done it again for ISON is the high resolution STEREO H1A imager images. This is more tricky as STEREO-A does not have the same field of view as Earth, so I needed to make a special ephemeris using JPL horizons based on the STEREO-A spacecraft's position.
They match to within 8 arc seconds. This means that ISON is on track in it's predicted orbit, and will come no closer to Earth than 0.43 AU. The rather compact debris trail will be high above Earth's orbit heading out to space. Oh yes, and the leftover material will not be "city sized". ISON itself was less than 1 Km in diameter (more like 600 meters), the biggest bits in the leftover gravel will be meter sized, at the outside as big as the Chelyabinsk meteor. If the debris cloud did come near us, we would get a pretty meteor display, but nothing more.
But of course, they will not come anywhere near us.
Labels: C/2012 S1 ISON, Meteors, Pseudoscience, Stereo Satellite
Thursday, September 19, 2013
Earthquakes and Planetary Alignments, Yet Again.
 |  |
| Saturn-Earth "Alignment" on September the 18th, Venus is off the alignment axis. As this "alignment" doesn't actually pass through the Earth-Moon-Sun axis it actually decreases the tidal force, reducing the likelihood of Earthquakes. Click to embiggen. | Venus near Saturn. Apparently this is a close alignment. |
As I write it is the waning hours of September 19. Why does this matter? Because the Barcarroler had predicted a 6.6 magnitude quake on the 18th.
The Barcarroler predicts earthquakes based on a combination of planetary alignments and astrology. I've written about alignments and earthquakes before (See here, here and here). Basically, while it is plausible that crustal tides might set off earthquakes lunar alignments have no significant effect. The tidal effects of distant planets, millions to billions of times weaker than the Moon, can have no effect.
None the less, this does not deter the Barcarroler. Over the past 12 months (2012, 2013 predictions) he has made 15 predictions for earthquakes of magnitude 7 or over, how has that panned out?
| Predicted date | Predicted Magnitude | Quake Occurred |
| Aug 14, 2012 | 7.2 | No |
| Oct 26, 2012 | 7.2 | No |
| Nov 14, 2012 | 7.2 | No |
| Dec 17-18, 2012 | 7.5 | No |
| Dec 21-22, 2012 | 8.0 | No |
| Jan 18-19 | 7.0 | No |
| Jan 28-29 | 7.5 | No |
| Mar 27-28 | 8.0 | No |
| April 5-6 | 7.5 Black Sea region | 7.0 Indonesia, April 6 |
| April 28-29 | 7.8 | No |
| May 10-11 | 7.5 | No |
| May 25-26 | 7.7 Peru, NI New Zealand | Earthquakes on 24th, Tonga/Russia |
| June 19-20 | 8.3 | No |
| July 20-30 | 7.5-7.8 | No |
| Aug 25-26 | 7.8 | No |
| Sept 18 | 6.6 | No |
Actual earthquake dates and magnitudes from Geosciences Australia. Of the 15 Earthquakes predicted in the 12 months since August 2012, one fell within the prediction interval (the magnitude was out as was the location, but we will accept this one) and one fell just outside the predicted time (and in completely different spots).
If we include the near miss this represents an 87% failure rate. If we look at the 18 earthquakes of M7+ that did occur, this represents an 89% failure rate. This is just slightly worse than what could have been achieved by guessing randomly (you would have expected to get 3 earthquakes right just from random guessing allowing +/- one day either side of the guessed range). So, we can conclude that the Barcarroler's prediction success is worse than just guessing.
Oh, and has a magnitude 6+ quake occurred? No, another Barcarroler's prediction failed. As there is a magnitude 6-6.9 quake every 2.7 days on average, missing this is pretty sad for his method, as if a 87% failure rate wasn't bad enough.
A good video on why the Barcarroler's alignments are not valid is here. My extensive list of postings on astronomical phenomena and earthquakes is here.
Labels: Conjunction, earthquakes, Pseudoscience
Tuesday, March 26, 2013
What Have We Learned From the Asteroid DA2013cl2 Hoax?

This is just the latest in a string of hoaxes and false doomsday predictions. Remember asteroid 2014 AZ5? How about the Mayan Calender apocalypse? Comet Elenin?
There's no point saying we don't learn from these things, new people come onto the internet all the time, or have missed out on the previous hoaxes. There is always a new audience who have never come across these scams before. And these are not harmless scams, people get worried sick about them, and it could push vulnerable people to self harm.
What to do? When these kind of hoaxes come up we can do our utmost to debunk them, rather than ignor them as we are sorely tempted, and more than debunk them, we can try and give people the mental tool box that will help keep them from being taken in by these hoaxes again.
Get them to look at the source of the information (conspiracy forums is never a good source of information), is it consistent, can it be traced back to where the information is supposed to come from? Is the alleged spokesperson real. These are all fairly easy to do, and you can step people through the process.
Other things, like the real naming conventions for asteroid and similar technical matters are harder, but some simple guides to reliable web searching so people realise how to look effectively for this information will again help people so that they won't be fooled (the hyperlinks above give my approach to this for each of the cases above, judge for yourself if this works).
There will be other hoaxes, our fond wish tha post the failed Mayan Apocalypse people would be immunised against apocalyptic scares was not granted. But if we can help people identify hoaxes, we can limit the emotional damage they can do.
Labels: asteroids, Pseudoscience, science communicators
Monday, March 18, 2013
Yet Another Asteroid Hoax (There will be no Meteor Hitting Mexico this Month)
This is a hoax. There are a number of ways you can tell it is a hoax.
1) The story is illustrated with a picture of comet C/2011 L4 PanSTARRS, not an asteroid.
2) It does not have a real asteroid name, asteroids that do not have proper names (like 4 Vesta), are named year, alphabetical identifier, numerical identifier (eg 2012 DA14). There's a 2013 CL2, but that comes nowhere near us, there's a 2013 CL22, which has a 1/10,000,000 chance of hitting us in 2064, but nothing that fits the hoax description.
3) A 300 meter asteroid impact would be serious, with an impact energy of 1110 Mt or TNT, creating a crater 4.6 Km in diameter, but it's no civilisation killer. The Creataceous/Tertiary impactor that did in the dinosaurs (at least in part) was around 10 Km in diameter.
4) Outside of the various posts promulgating this story, there is no astronomy Professor Herbert Raymond Brown
5) There is no high risk asteroid of any sort in the asteroid hazard lists.
Labels: asteroids, Hoax, Pseudoscience
Thursday, March 07, 2013
Asteroid 2014 AZ5 Will Not Hit Earth (Because it Doesn't Exist)
"The space rock, which is called 2014 AZ5, is about 960 feet wide. It may come hit Earth in early 2013 and there are urgent meetings going on among scientists on how deflect it."There are a few clues that this is a fake. One is the spokesman, Quami Lochmo, doesn't actually exist (and his name changes in the "press release"). Another is the complete lack of any such story on the ESA site. Yet Another is that the story originated in the World Weekly News, a publication notorious for not letting facts get in the way of a good story.
The there is the fact that asteroid naming conventions require the asteroid to be named with the year of its discovery, without a time machine, you can't have an Asteroid named 2014 AZ5, and there is none in the Minor Planet Center (but there is an asteroid 2013 AZ5, which will come nowhere near us).
So, you can breath easy, no killer asteroid this month.
Labels: asteroids, NEO, Pseudoscience, science communicators
Saturday, January 26, 2013
Sketching Jupiter (or No Jupiter Hasn't Tilted)
 |  |
| Jupiter sketched through my 50 mm unguided refractor (Alt Azmithal mount) on the nights of 15, 16 and 19 January | Jupiter as predicted by Stellarium (images inverted as my telescope inverts the image, and Stellarium doesn't in Alt AZ mode) |
As I've mentioned before, the latest panic du jour is that Jupiter and Saturn are mysteriously tilting. David Greg has been imaging Jupiter, but I thought I'd present some of the sketches I did while on holiday down the coast.
For travelling, I use the little 50 mm refractor that I got when I was a teenager, it has an old and somewhat cranky alt/Az mounting, but it fits nicely in the back of an overloaded car and is good for the Moon and planets.
Since getting my webcam cameras set up and getting the digital camera adapter, I haven't done any sketching or about two years, so it was good to get back into it. Unfortunately, when sketching at home I have a red light torch to illuminate my note book, and a comfortable chair to sit on. This time I had to sketch on insolated sheets of paper in the semi-dark while crouching uncomfortably over the eye piece.
However, despite these limitations my drawing pretty closely match the predicted Stellarium position for Alt/Az mountings (when flipped because my telescope inverts the image, and Stellarium doesn't when in Alt/Az mode). I didn't look at the predictions until after I had made the sketches (at the very least because my computer with Stellarium on it was an hour and a half away).
So, no planetary pole flip.
Labels: Jupiter, Pseudoscience, sketch
Sunday, January 13, 2013
News Flash! Jupiters Orbit Tilited with Respect to the Ecliptic, The Pole Hasn't Shifted
 |  |
 |  |
These contentions are supported by a variety of telescope and SOHO imager artefacts, and a poor understanding of what planets look like through a telescope.
A prime example is here. Now Dave Greg has dealt extensively with the telescope appearance imager artefact side of things (see here, here and here).
But there is one area where I feel the need for a bit more comment. The video says it will show you shocking evidence that Jupiter has moved from the ecliptic. The images above are a series of images from SOHO, where the position of Jupiter in the SOHO imager has changed. In the images above I've shown the same SOHO images as are in the video, and Jupiters position is different with respect to the central occulting disk. The fourth image is an overlya of the previous three to show the changes clearly.
"Why Hasn't Astronomy Pointed out Disturbed Orbits?" asks the video after the SOHO images.Because the orbits aren't disturbed. Jupiter is exactly where we expect it to be, because Jupiter's orbit is not exactly on the plane of the ecliptic, but at an angle to it.
 |  |
 |  |
Jupiter's orbit is inclined to the plane of the ecliptci by one degree. This may not sound much, but it is twice the apparent diameter of the Sun (and Moon), thus in its orbit, Jupiter can move (from earth's perspective), substantially above and below the ecliptic. The black and white charts above (click to embiggen for a better view) shows the predicted position of Jupiter at the same dates as in the SOHO images as seem from Earth.
As with the SOHO images, the fourth image is an overlay of the previous three to show the changes clearly. The central black line is the plane of the ecliptic and the big circle the Sun. Jupiter is labelled. Note that in the SOHO images the occulting disk is bigger than the Sun, so in image one in the SOHO series the occulting disk touches Mercury,
They are almost identical to that of SOHO, but aren't exactly the same as SOHO is in a halo orbit around Lagrange point 1, and has a slightly different point of view to that of Earth. Nonetheless, the charts show that the amount of movement we see in the SOHO images is what we expect of Jupiter's orbit.
Note that the software I am using is from 2005, using a 1989 model of the planets orbits, which has not been updated. Thus the agreement between the plotted positions and the observed positions is not due to post facto orbit tweaking.

Planetary orbits have not been disturbed, the planets positions are exactly where we expect them to be. It is hard to tell if the posters of these claims, like the poster of the video we have been discussion, are merely deeply clueless about astronomy, or are deliberately trying to wind people up.
In the meantime, the next tie someone posts a video or claim that the planets orbits are disturbed, ask yourself "how would hundreds of thousands of amateur astronomers not notice this?" and contavt your local planetarium if you are worried.
Labels: Jupiter, Pseudoscience, Satellite, Soho
Thursday, December 20, 2012
The End of the World, Mayan Calendars, and a whole bunch of Stuff

As I type "end of the world" hysteria is rising to a climax. If you somehow managed to miss it, 21 December is when the Mayan Long Count Calendar clicks over from 12.19.19.17.19 to 13.0.0.0.0. Various groups have associated this Calendrical change with a variety of apocalyptic scenarios, just as happened when we went from 1999 to 2000 in our calendar.
Of course, nothing apocalyptic happened on January 1 2000, nor will anything apocalyptic on 13.0.0.0.0. The ancient Mayan's did not think the end of the world would happen then, nor do modern Maya.
Various apocalyptic scenarios have been proposed, from rather unexciting "change of consciousness" to beams of gamma rays from the black hole at the galaxies centre causing the sun to erupt in solar flares.
None of these things are going to happen, and there are are many good sources that cover the various panics that are afflicting people.
1) Crossing the galactic plane. The solar system doesn't actually cross the galactic plane, and won't for a few million years. We do cross the galactic equator, but this does not put us in line with the black hole at the centre of our galaxy. Furthermore, we cross the galactic equator twice a year, and have done so since 1998 without ill effects.

The image at the left shows the planets on the 21st, Saturn-Venus-Sun appear to be aligned, but Saturn is far above the plane of Venus's orbit, and does not fall on a Sun-Venus axis. I talk in more detail about alignments here.
3) Killer solar flares. A Massive solar flare like the Carrington event would be very destructive, but these are extremely rare. We have survived flares rated up to X20 (really high) quite well. These flares may be inconvenient and expensive in lost telecommunications and the odd burnt-out satellite, but they aren't civilization crashers. As well, this solar maximum is rather weak, with few X class flares, and no active sunspots at the moment. We are not going to get killer flares form the few puny sunspots around at the moment.
4) Mysterious giant planets/brown dwarfs hanging around in the solar system. Any close enough to do anything to the Earth would have been painfully bright in the sky months ago. Continual misidentifing of various objects from lens flares to the Pleiades as planets does not count.
5) Pole shift. There is a bit of confusion here between the Earth's axis of rotation (which will not shift short of something the size of Mars colliding with us, and the magnetic poles, which do shift, and reverse every few tens of thousands of years. Magnetic pole reversals occur over thousands of years, not instantaneously so at the worst we might have some confused birds, but no Apocalypse.
It all seems silly, but there are people who are taken in by the hype, and who are being worried for no reason. As with previous apocalypses people are going to great effort to move to "safe havens" a great cost in time, money and peace of mind.
Here's a number of Good Links for you with more details:
2012Hoax
Ask an Astrobiologist 2012 FAQ with lots of good links and videos.
NASA's Mayan Calendar site
Wikiperdia's 2012 Phenomenon site.
The SETI Institute 2012 site.
And here's my lighter take on the post apocalypse events.
Labels: Pseudoscience
Friday, December 07, 2012
December 11, Alternative Medicine versus Science: Winners and Losers (ASCSA Public Event)

The presentations will examine Pseudoscience, particularly in the context of Medicine. Our distinguished panel comprises real scientists and science communicators, all with a healthy disrespect for those who would tout snake oil. It promises to be a cracking good night.
I'm one of the presenters, and I'll be giving you a small dose of homoeopathy. The others are:
Professor Rob Morrison (Science Communicator): What and why about Friends of Science in medicine; why pseudosciences are not science
Tory Shepherd (Journalist, The Advertiser): Pseudoscience and the public, the media angle
Professor Marcello Costa (Prof of Neurophysiology, School of Medicine, Flinders University): Moving science into the medical arena
Professor Alastair MacLennan (Professor of Obstetrics and Gynaecology, Faculty of Health Sciences, University of Adelaide): In depth case studies for medical impact on women/children’s health
Location:
The Science Exchange
55 Exchange Pl Adelaide, SA 5000 Australia
Tuesday, December 11, 2012 from 6:00 PM to 7:30 PM (CST)
Book via EventBrite here: http://ascsapseudoscience.eventbrite.com.au
Cost:
ASC members & RiAus members: Free
Non-members: $5
Labels: Pseudoscience, science communicators, science matters
Saturday, November 24, 2012
Planetary Alignments and X-Class Solar Flares, Just by Chance

Hot on the heels of claims about alignments and earthquakes, comes the notion that planetary alignments are associated with solar flares. A recent video points out that the Carrington event, the most massive solar flare ever recorded, occurred during an "alignment" (see also here). It then goes on to draw a very long bow to try and associate solar flares with planetary alignments.
Again, people apparently think that because planets are large, they will have significant gravitational/tidal effects that might affect the Sun, but as we have previously seen, these effects fall off rapidly with distance, with Venus having less than a millionth of the tidal force of the Moon, for example.
The problem is that, during a solar maximum, there are a lot of flares. There are also a lot of alignments (depending on how you define alignment, well get to that later). By chance alone you would expect to see flares and alignments overlap occasionally.

How frequent are flares? Well, it depends on the size of the flare and the time. The rarest and most powerful events are the X-class flares (the Carrington Event was a super X flare), and we have the most of these during solar maximum.
According to this document, there is an average of one X-class flare a month during solar maximum (which would mean that alignments and flares would pretty well occur often by chance alone). M and C class flares are even more common, the amount of data makes it hard to work with.
Of course, the flares are not evenly distributed, with far more occurring during the peak years than the start years.
I've approached the issue of alignments and flares in two ways.
- I've taken the list of most powerful X class flares since 1976 and looked at whether there were alignments close to or during these times.
- I've looked at all alignments during the 2001-2003 solar maximum, when there were the most X-class flares, and looked to see if they are significantly associated with flares.
 For example, for the alignment on the "Night of the Smiley Face Fritz", Venus, Jupiter and the crescent Moon were all together within 3º of each other. On the same night, Mars, Mercury and the Sun were all within 3º of each other (there weren't any X-class flares though).
The "alignment" at the time of the Carrington Event had Mercury, Venus, Mars and Saturn strung out in a line that covered 12º, with Venus 7 º from the Sun. This is pretty marginal as alignments go.
For example, much tighter and closer alignments have not produced any significant solar flares. Like the 17 June 1872 conjunction when Venus, Mars and Mercury were all within 1º of each other and 7º from the Sun, nothing happened, or 22 August 1891, when Mars and Venus were 0.01º from each other and 7º from the Sun, or 19 June 1904 when Mars and Venus were 0.3º from each other and 5º from the Sun.
Or 24 August 1987, when Venus and Mars were lees than 30' (arc seconds) apart, 1º from the Sun, the Moon 3º away and Mercury 4º away, Zilch (solar flare wise).
But these are isolated examples, to get an unbiased picture of what is going on, we need to look at statistically valid samples of flares and alignments.
Which brings us back to what an alignment is.
For the purposes of this exercise, for a single planet to be aligned with the Sun, it has to be within 5º of it. For multiple planets, I've allowed that two planets must be within at last 10º of each other and at least one member of the group within 15º of the Sun.
So with those definitions, what does the flare/alignment profile look like.
Table 1. The most powerful X class flares since 1976 and their association with alignments. Alignments found using the events tool in SkyMap. Alignments defined as described above.
| ------- | ------------------------------- | -------- | |
| Ranking | Day/Month/Year | ||
| ------- | ------------------------------- | X-Ray Class | Alignment Present? |
| 1 | 4/11/2003 | X28+ | No |
| 2 | 2/04/2001 | X20.0 | No |
| 2 | 16/08/1989 | X20.0 | No |
| 3 | 28/10/2003 | X17.2 | Mercury 2 degrees from Sun |
| 4 | 7/09/2005 | X17 | Venus and Moon close, but 40 degrees from Sun |
| 5 | 6/03/1989 | X15.0 | No |
| 5 | 11/07/1978 | X15.0 | Jupiter 25' from Sun |
| 6 | 15/04/2001 | X14.4 | No |
| 7 | 24/04/1984 | X13.0 | Mercury 3 degrees from Sun |
| 7 | 19/10/1989 | X13.0 | No |
| 8 | 15/12/1982 | X12.9 | Moon 4 degrees away |
| 9 | 6/06/1982 | X12.0 | No |
| 9 | 1/06/1991 | X12.0 | No |
| 9 | 4/06/1991 | X12.0 | No |
| 9 | 6/06/1991 | X12.0 | No |
| 9 | 11/06/1991 | X12.0 | No |
| 9 | 15/06/1991 | X12.0 | Mercury 3 degrees from Sun |
| 10 | 17/12/1982 | X10.1 | Mercury, Venus 2 degrees from each other, 7 degrees from Sun |
| 10 | 20/05/1984 | X10.1 | No |
| 11 | 29/10/2003 | X10 | Mercury 2 degrees from Sun |
| 11 | 25/01/1991 | X10.0 | No |
| 11 | 9/06/1991 | X10.0 | No |
| 12 | 9/07/1982 | X 9.8 | No |
| 12 | 29/09/1989 | X 9.8 | Mars 1 degree from Sun, Mercury and Moon 2 degrees appart 10 degress from Sun |
| 13 | 22/03/1991 | X 9.4 | No |
| 13 | 6/11/1997 | X 9.4 | No |
| 14 | 24/05/1990 | X 9.3 | Moon 8 degrees away |
| 15 | 5/12/2006 | X 9.0 | Mars, Mercury, Jupiter within 6 degrees of each other, Jupiter 10 degrees from Sun |
| 15 | 6/11/1980 | X 9.0 | No |
| 15 | 2/11/1992 | X 9.0 | No |

As you can see, there were no alignments during the most powerful X-class flare recorded since 1976, and neither was there an alignment during the 1989 flare that blacked out Canada. Mercury comes close to the Sun (in the absence of other planets nearby) during a few flares, but as Mercury comes close to the Sun often that is expected by chance alone.
So far not looking good for alignments and flares.
So lets look at alignments during the 2001-2003 peak of the last solar maximum.
Table 2. Planetary alignments during the last solar Maximum (2001-2003) and their association with X class flares. These are the dates when Venus and the Moon were aligned (minimum separation distance of 5º between Venus and the Moon, and maximum distance of 15º from the Sun). Other planets identified as being within either 5º of Venus or the Moon. Alignments identified using the events tool in SkyMap. Flare list from NASA, a flare occurring in the same month as any alignment was counted as positive.
| Date of Alignment | X-Class Flares? | Other Planet? |
| 25 Mar 2001 | Yes | No |
| 14 Nov 2001 | Yes | No |
| 14 Dec 2001 | Yes | No |
| 13 Jan 2002 | No | Mercury |
| 12 Feb 2002 | No | No |
| 15 May 2002 | No | No |
| 04 Nov 2002 | No | Mercury |
| 28 Jun 2003 | Yes | No |
| 28 Jul 2003 | No | Saturn |
| 27 Aug 2003 | No | Jupiter |
| 26 Sep 2003 | No | Mercury |
Again, not looking good for flares and alignments. While there were other occasions when planets were close together they all occur too far away from the Sun (>20º) to be meaningful in the solar flare context. Also, in quiet years alignments go on quite happily, without any flares (I leave this as an exercise for the reader).
Everything we have seen is entirely consistent with chance association with flares and alignments.
The video does give some predictions, but they are very fuzzy "may result in exaggerated solar activity" this could mean anything from mere M class flares to high rating X class flares. Certainly The two X class flares we have had since July (13 July X1.4 and 23 October X1.6), were not predicted. The predicted dates of August 22 and September 21 (and the days either side) are devoid of flare activity greater than C8. October 3 and October 14 (and the days either side) miss out on anything and October 21 has an M class flare.
Hardly an encouraging hit rate, given that since July we have had roughly a C8 or larger flare roughly every 4 days. You could do better by flipping a coin.
Planetary alignments and solar flares? Just say no!
Labels: alignment, Moon, Pseudoscience, Solar flare, Sun



 Click to read about or order
 Click to read about or order
 Click to read about or order
 Click to read about or order



